This article is for Davis 360 products, which includes Dosage Calc 360, Test Success 360 and Med Term 360. While we use Dosage Calc 360 as an example, this information applies to all Davis 360 products.
Metrics
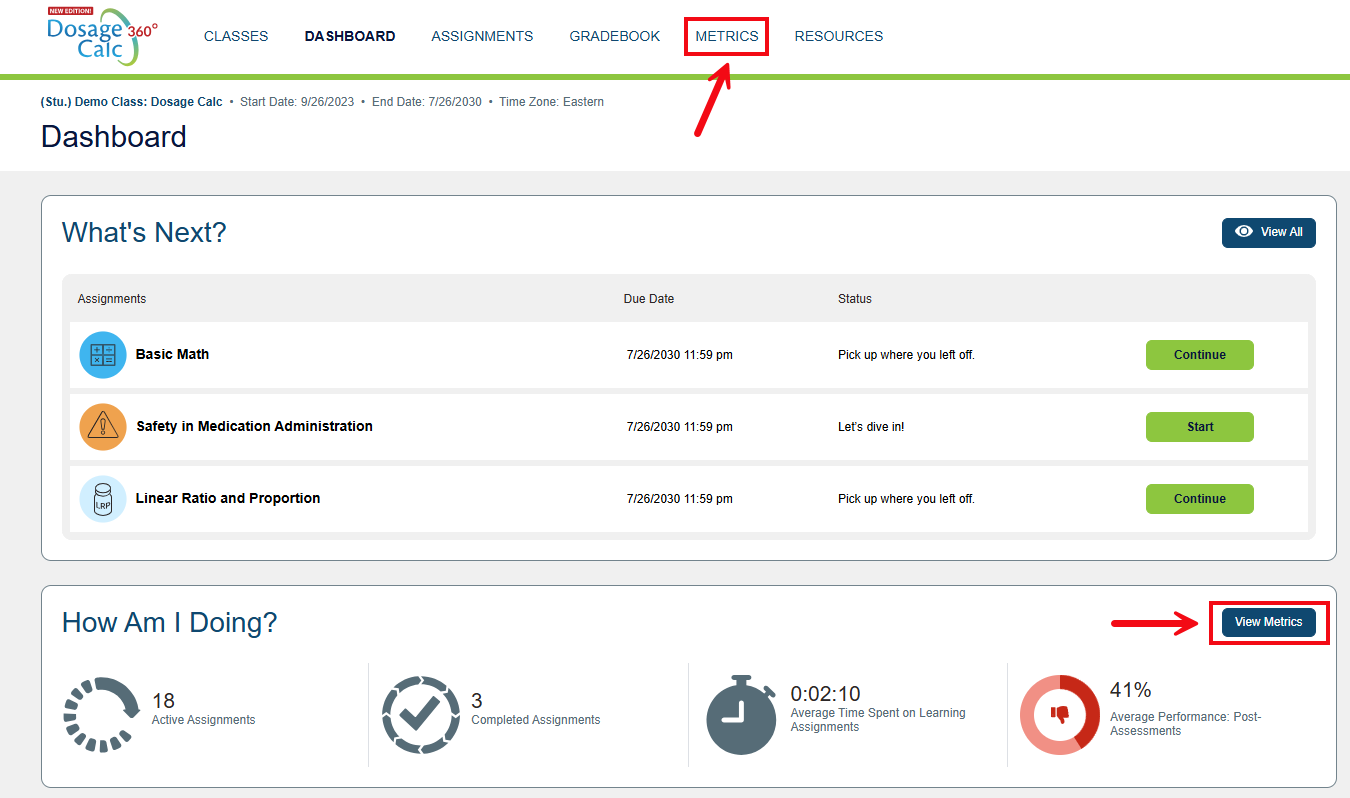
The Metrics view helps you to identify personal strengths and weaknesses on a topic-by-topic basis. To access from the Dashboard page, you can select the View Metrics button or click the Metrics option at the top of the page.
How Am I Doing?
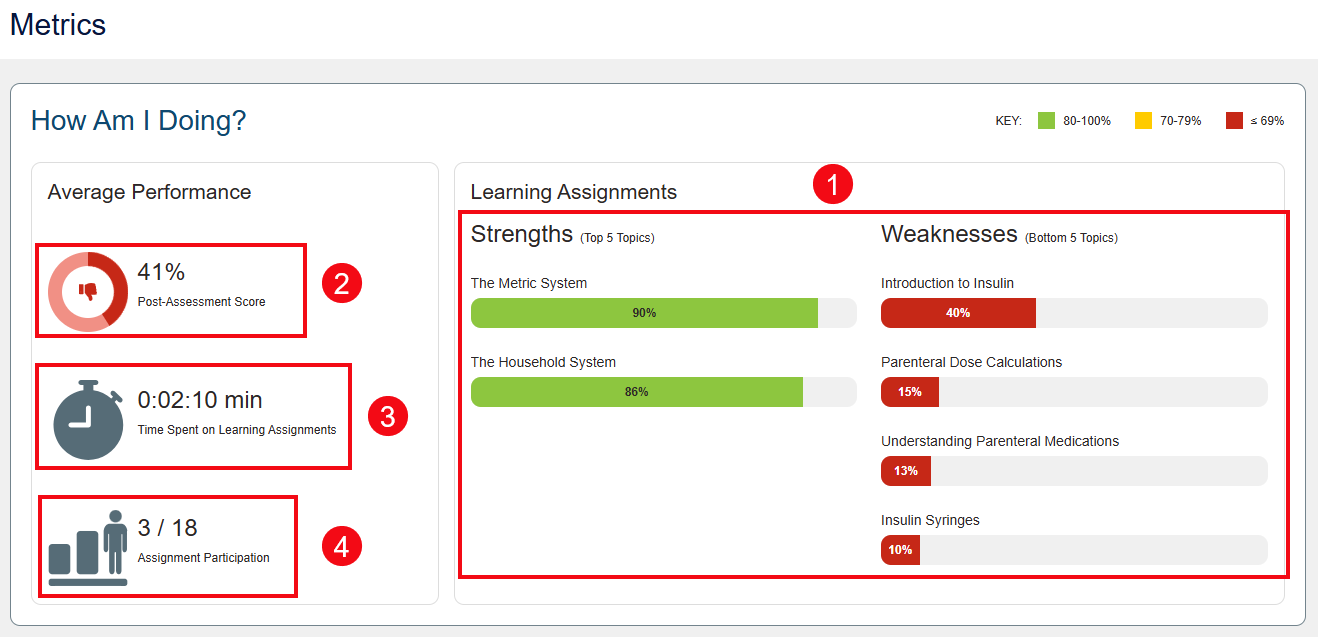
The How Am I Doing? panel will provide a look at your Top 5 (strongest) and Bottom 5 (weakest) topic areas, to help you prioritize your studies (1). This panel will also includes your average Post-Assessment Score (2), the time you've spent on Learning Assignments (3), and your overall Assignment Participation (4).
Performance Key
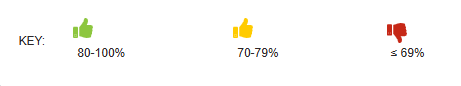
For each completed assignment, you may see:
-
Green thumbs-up: Your score for the assignment was 85% or better (demonstrating competency).
-
Yellow thumbs-up: Your score for the assignment was between 70-84%.
-
Red thumbs-down: Your score for the assignment was 69% or below (demonstrating a need for more practice).
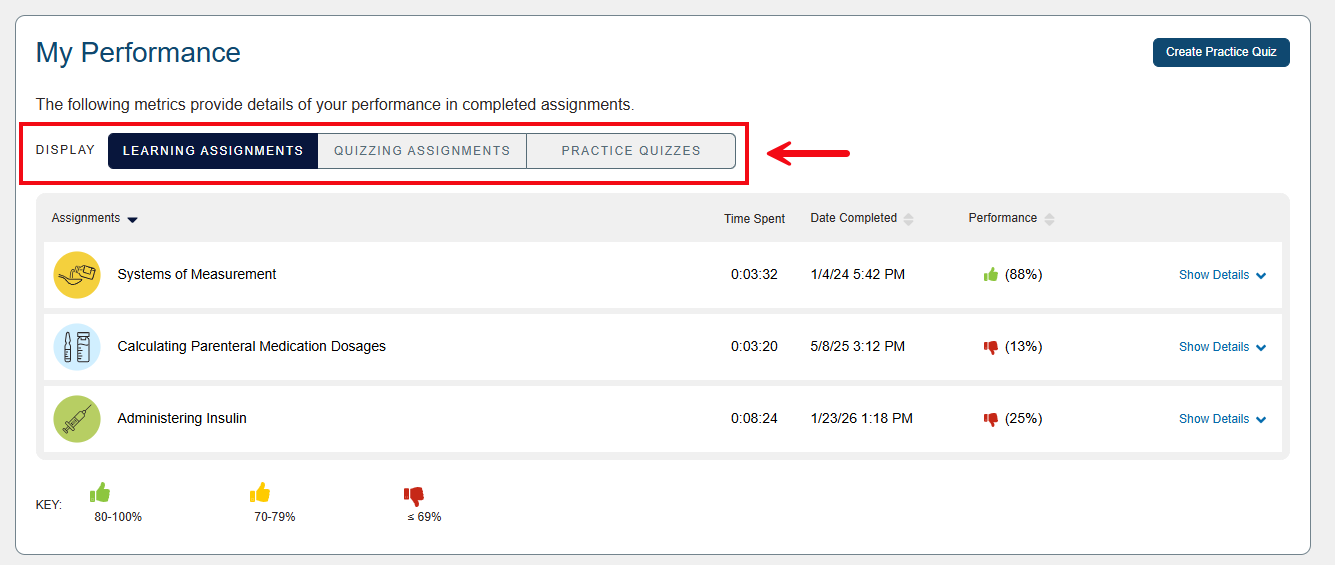
My Performance
The My Performance panel will let you view the specifics of your performance in your Learning Assignments, Quizzing Assignments, and Practice Quizzes. Choose which assignment type you'd like to display.
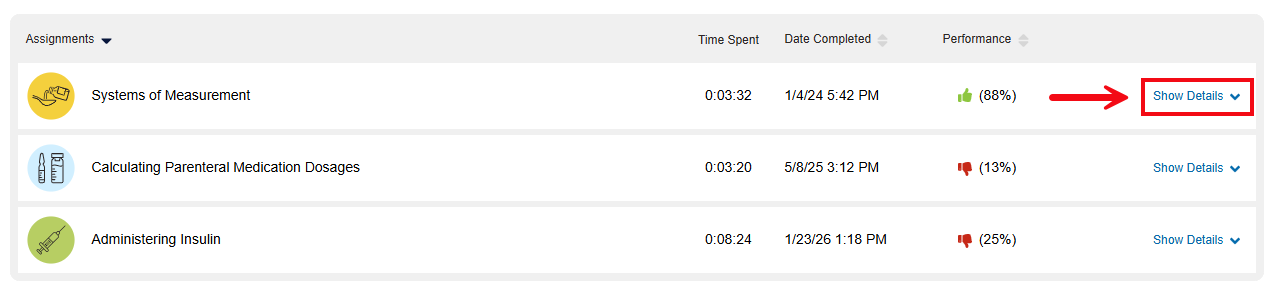
When viewing your performance on Learning Assignments, click the Show Details dropdown to open a table with performance details for each of the topics within a module.
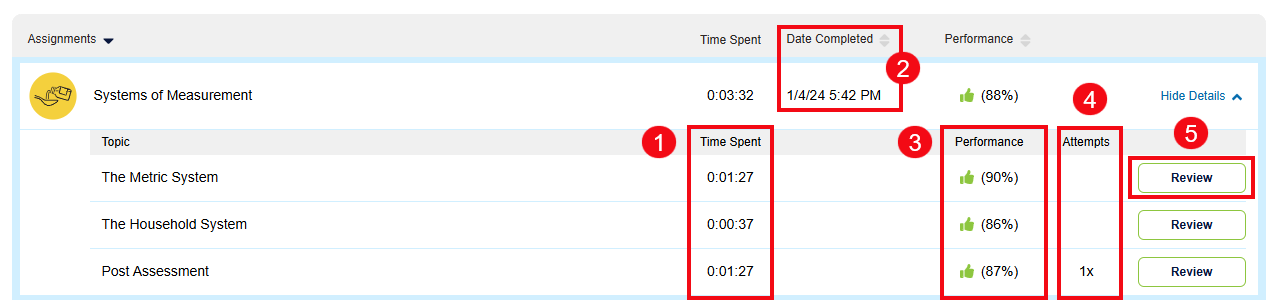
For each assignment, you will see the time spent on the module and topics (1), the date the module was completed (2), the performance score (3), the number of attempts taken (4), and the Review button which allows you to review your answers and the rationales for each question (5).
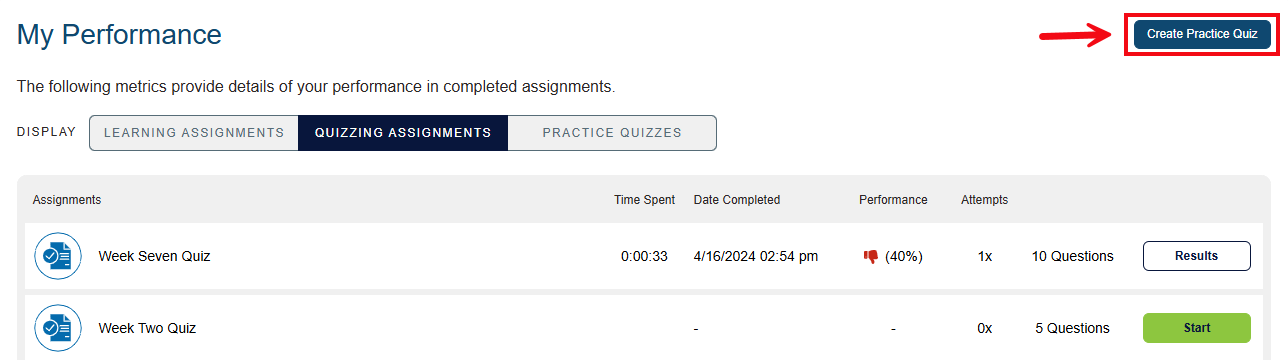
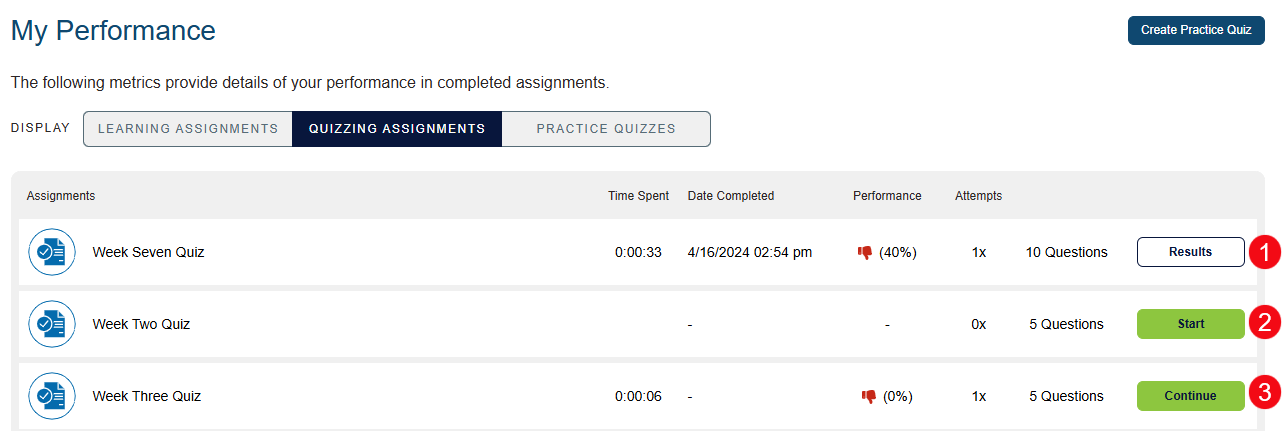
In the Quizzing Assignments display option of your My Performance panel, you can review your results on Quizzing Assignments you've taken by clicking the Results button (1). You can continue working on Quizzing Assignments you already started by clicking the Continue button (2). You can also start any new Quizzing Assignments by clicking the Start button (3).
In the Practice Quizzes display option of your My Performance panel, you can review your results on Practice Quizzes you've taken. Additionally, within any of the My Performance display options, you can click the Create Practice Quiz button to launch the Practice Quiz builder.