

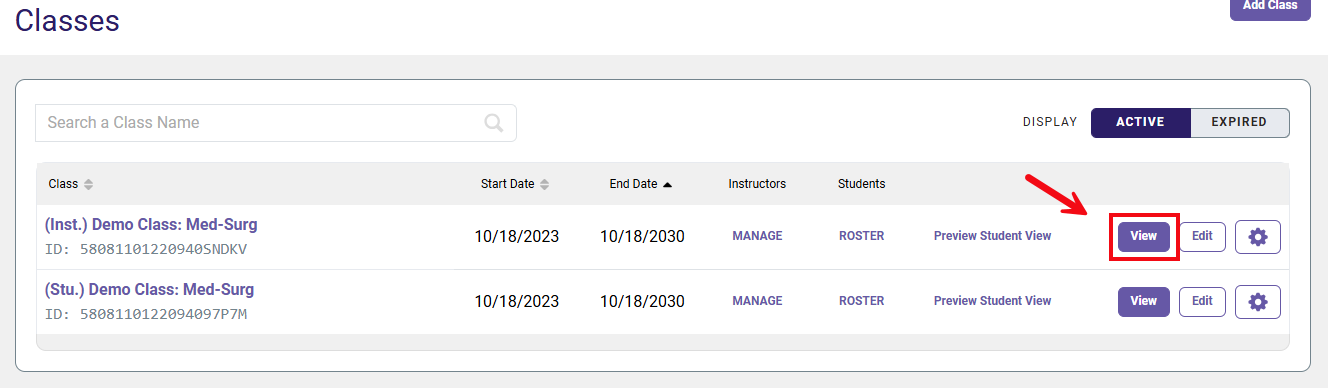
The Dashboard displays information about your students’ performance. Select the View button on the line with the name of your class.
At a glance, the Dashboard View provides you with several actionable analytics for your students' performance on each of the three different assignment types in Advantage: Personalized Learning, Clinical Judgment, and Quizzing. For each assignment type, you can quickly review the class-wide average performance (1), time spent on assignments (2), and rate of participation (3).
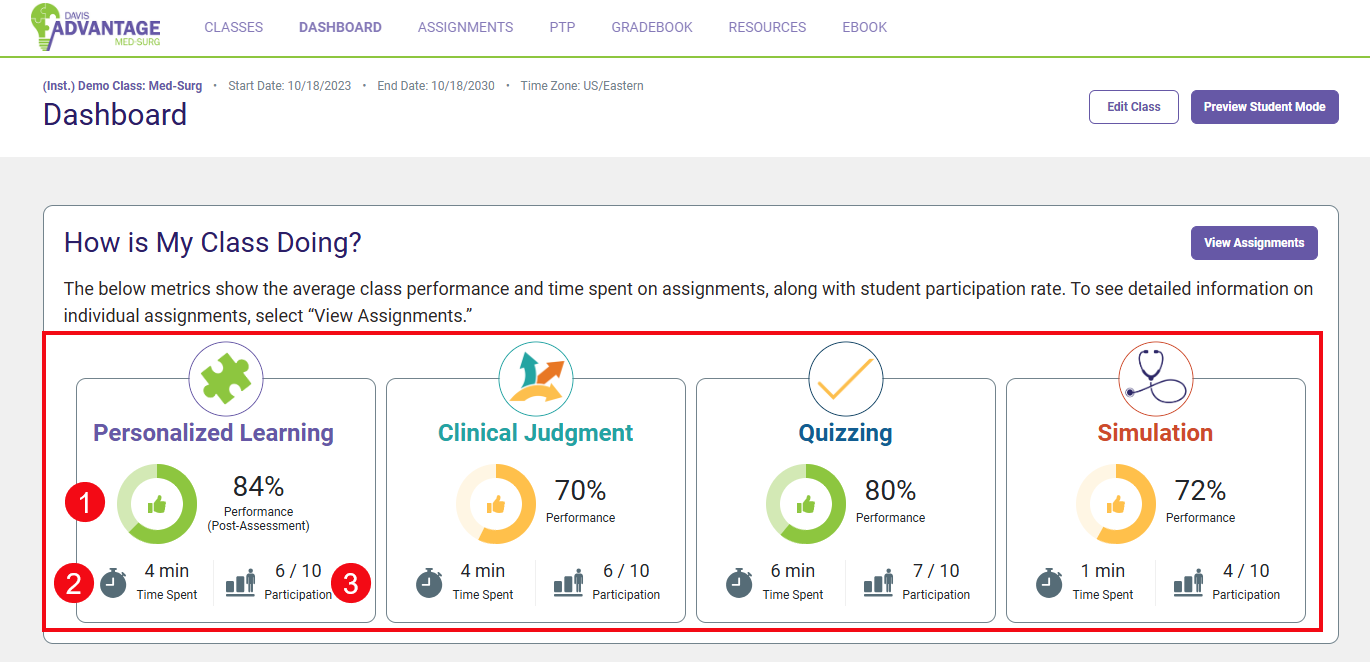
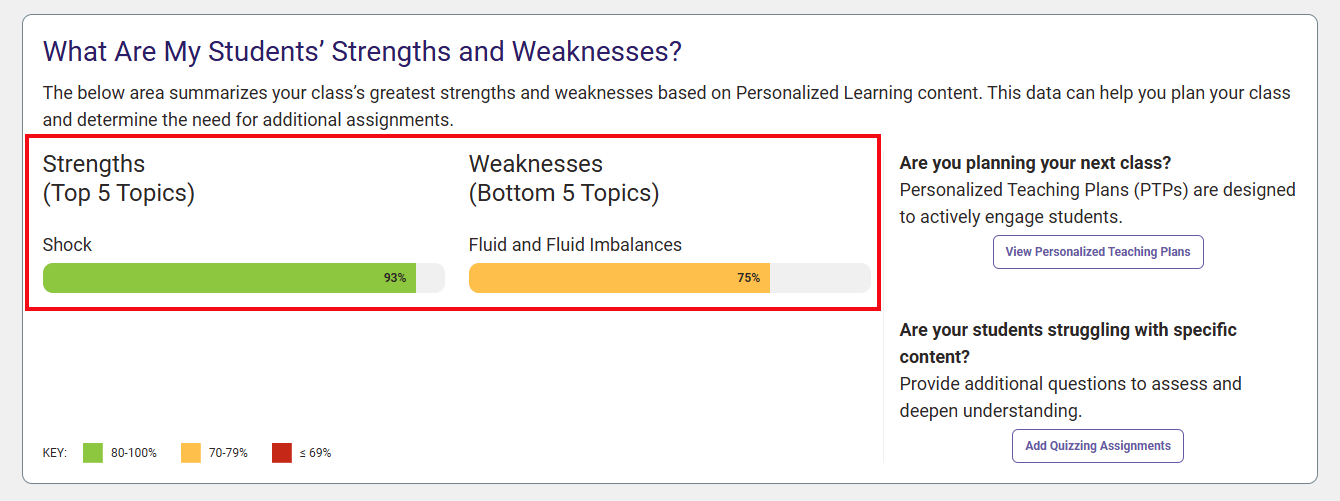
As your students complete more work in the platform, the dashboard will also populate strengths and weaknesses to show you your students' strongest and weakest topic areas.
View Assignments
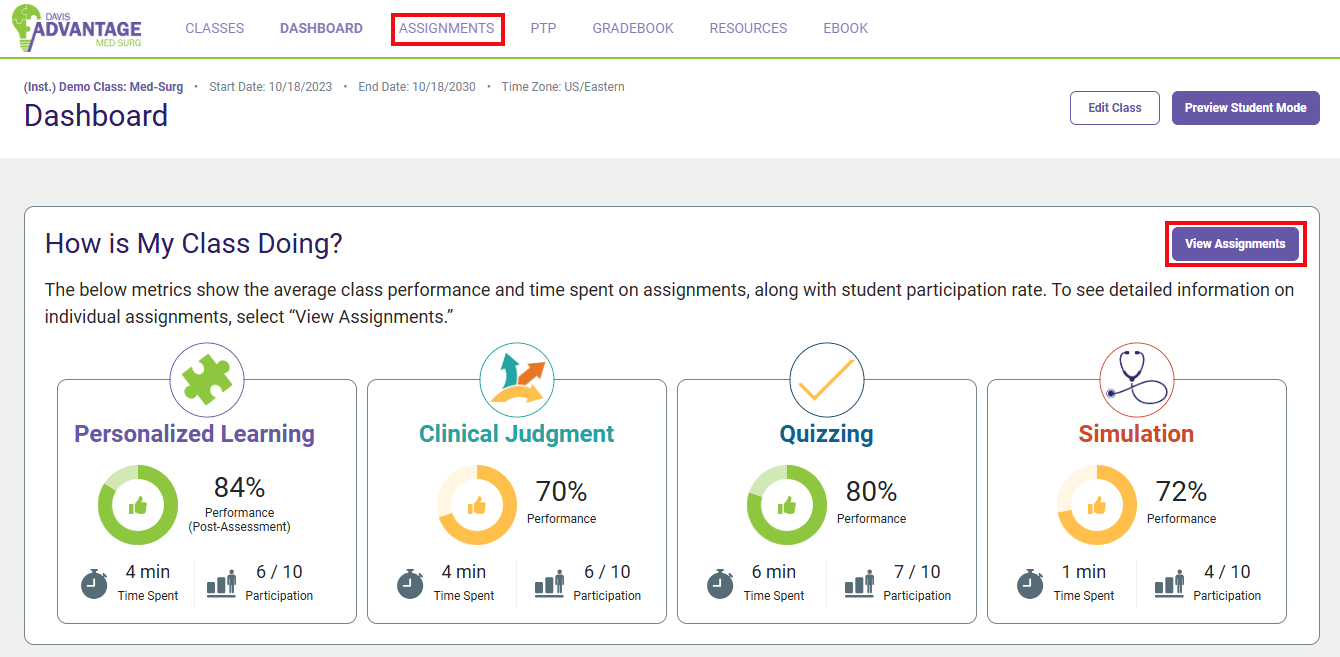
To view your students’ performance on each assigned topic, you can either click Assignments at the top of the screen, or click View Assignments in the How is my Class Doing? section.
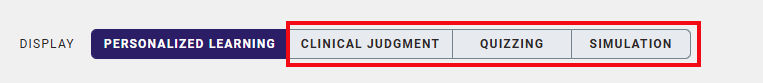
On the Assignments page, you can review due dates, student participation/completion rates, and average time spent on specific Davis Advantage assignments. You can use the Display tab to view separate listings of class performance on Clinical Judgment and Quizzing assignments. You can also quickly access your Class Setup from this page to Edit Assignments.
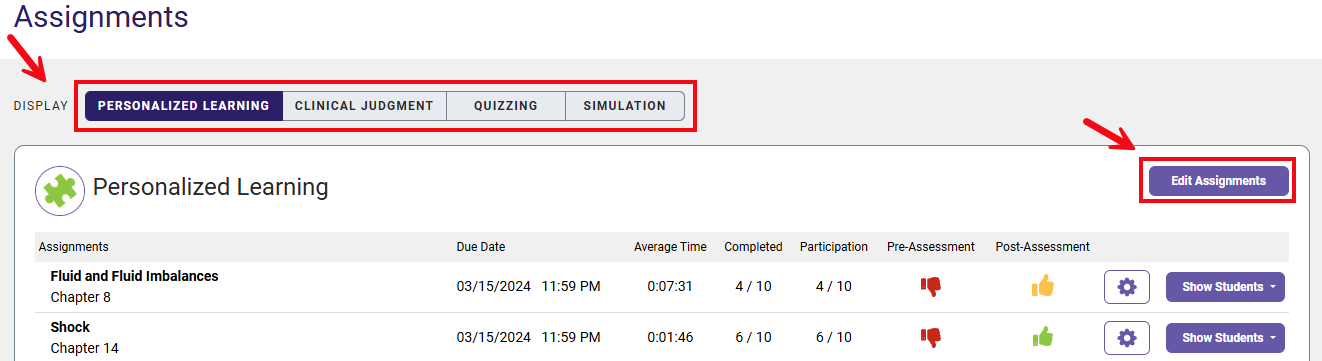
The assignments page will open by default to the full list of Personalized Learning assignments for your course. For each topic, a quick glance reveals overall class performance on the pre- and post-assessments. For overall assessment performance, you will see the following…
Red thumbs-down: The average score for the class on the assessment is less than or equal to 69%.
Yellow thumbs-up: The average score for the class on the assessment is between 70–79%.
Green thumbs-up: The average score for the class on the assessment is 80% or above.
For each topic listed, you will also see the assignment Due Date (1), the Average Time spent on that specific assignment (2), how many students Completed the assignment (3), the rate of Participation showing how many students began the assignment (4), and the Show Students button (5).
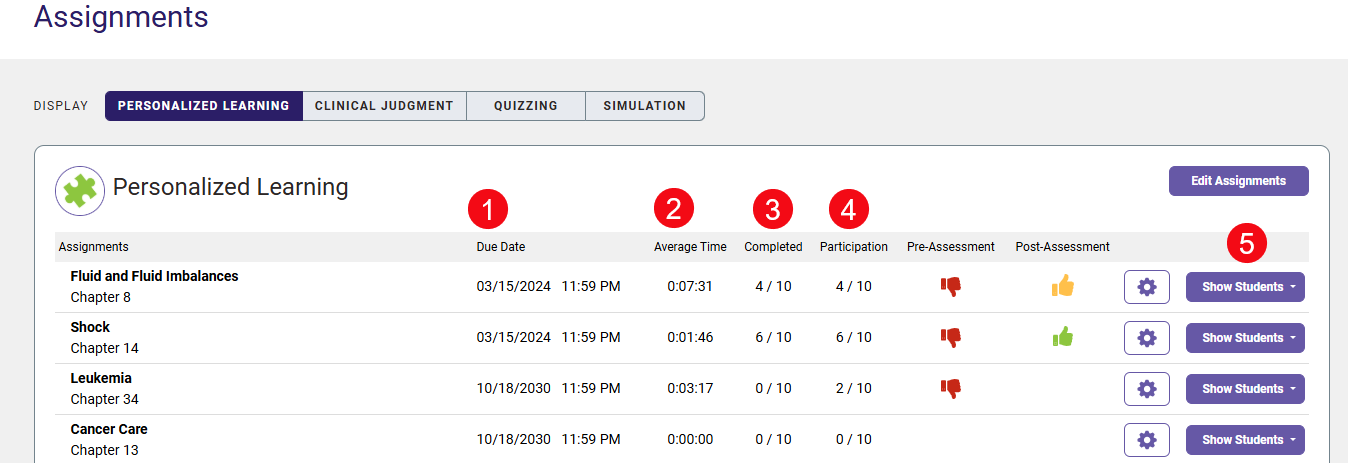
The Show Students button allows you to view more granular metrics for individual student performance on a specific topic and assignment type.
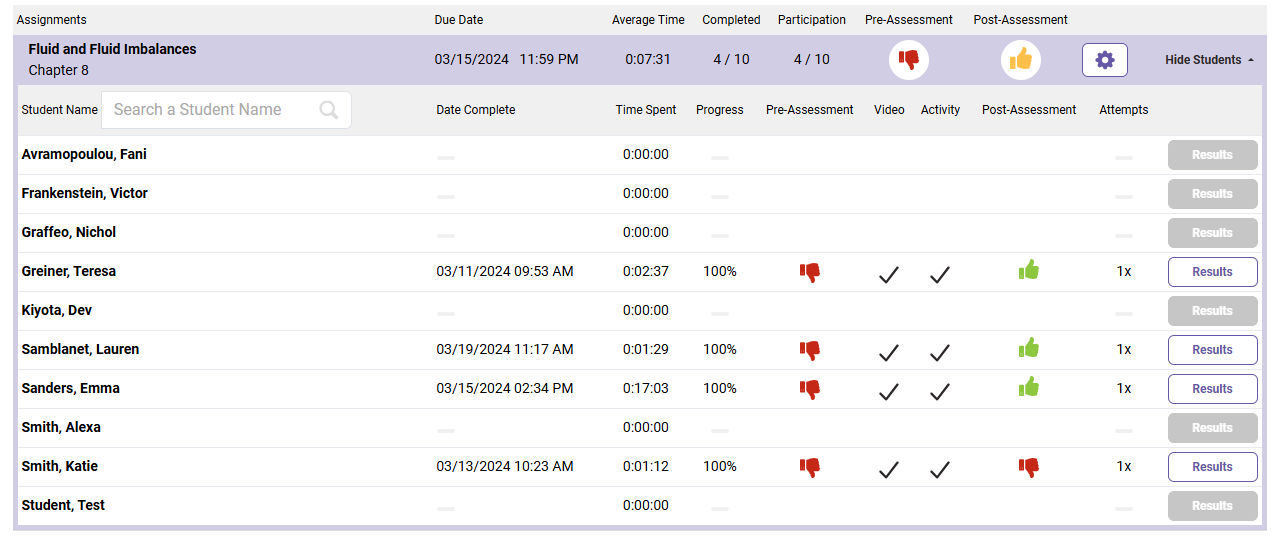
The thumbs up/thumbs down icons tell you how each student performed on each step of the Personalized Learning Assignments. Individual students receive:
- Red thumbs-down if they score less than 80% on a pre- or post-assessment for a topic (demonstrating the need for remediation)
- Green thumbs-up if they score 80% or greater on a pre- or post-assessment for a topic (demonstrating competency)
Note: If a student has completed the Post-Assessment more than once, the thumb icon will be replaced with the number of attempts they made. This can be seen in the second example below (4).
View Details also allows you to review the date each student completed their work (1), the time students spent on the assignment (2), current level of Progress on the assignment (3), how many attempts each student took for the assignment (4), and the Results button (5).
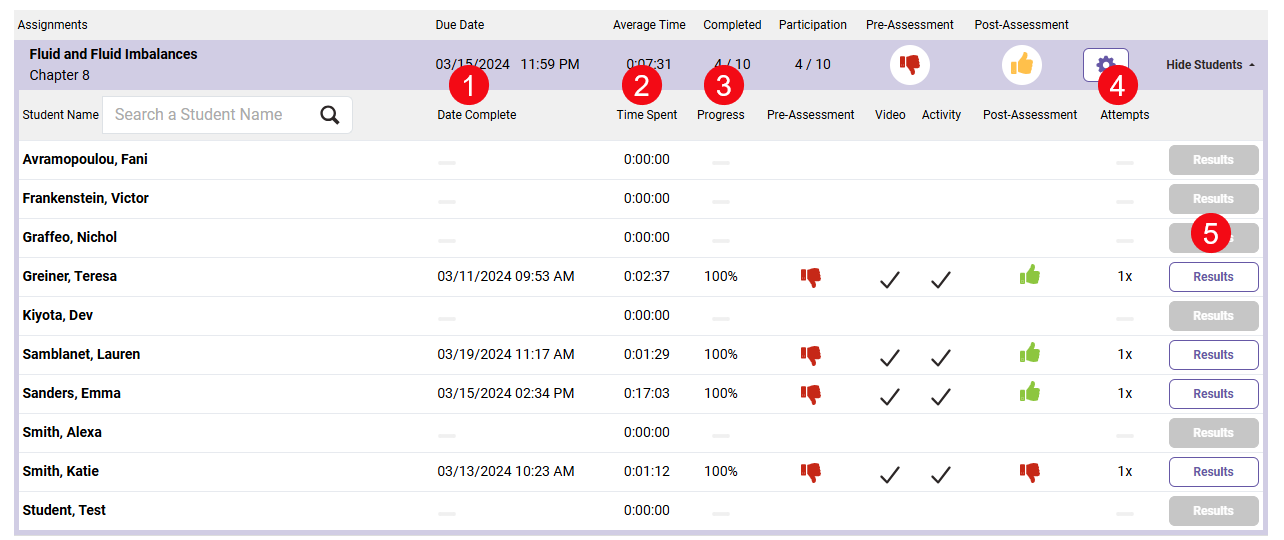
Note on Progress: The percentages reported for each student’s progress are based on the Learning Requirements you established while setting up your class. In the example above, the instructor chose to not require students to complete the Video, Activity and Post-Assessment if they scored 80% or above (a green thumbs up) on the initial Pre-Assessment quiz. The students in this class are only required to complete the entire activity if the received a red thumbs down.
To view an individual student’s responses to the pre-and post-assessment, click Results (5). The student's answers will appear in a new pop-up window.

If you want to view student analytics for Clinical Judgment assignments, select “Clinical Judgement” on the Display tab. If you want to view Quizzing assignments, select "Quizzing."
Clinical Judgment and Quizzing assignment analytics are both displayed in the same general layout as the Personalized Learning assignments, with some assignment-specific variations.
For student performance on Clinical Judgment assignments, you'll see the Date the student Completed the work (1), the time the student spent (2), the Percent Correct of questions answered for the student's best attempt (3), the Competency (4), the number of Attempts (5), and a button to View Results for individual student answers (6).
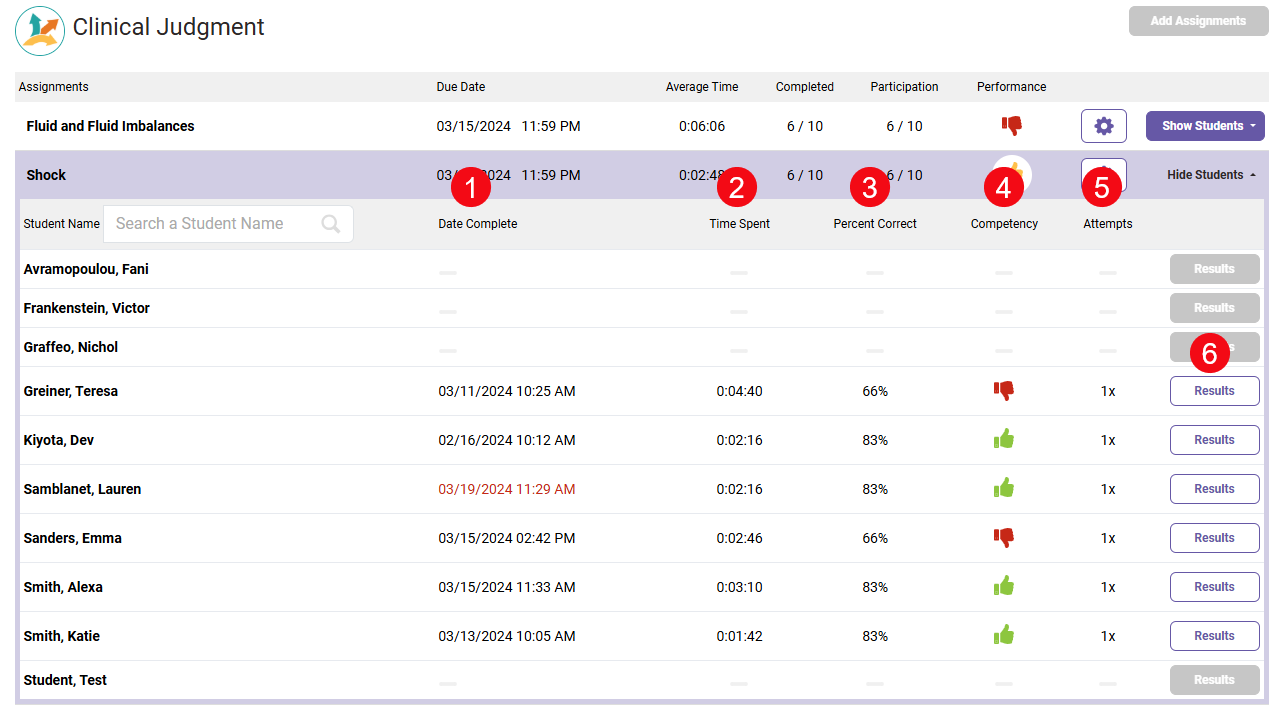
You'll see the same information for Quizzing Assignments, with the exception that you won't see a number for how many times a student has completed a Quizzing assignment, because they are single-take assignments. If you want to reset a Quizzing assignment for a student, so they'll be given a blank slate to retry the assignment at-hand, you can reset Quizzes via your Gradebook page.


