This article is for Davis 360 products, which includes Dosage Calc 360, Test Success 360 and Med Term 360. While we use Dosage Calc 360 as an example, this information applies to all Davis 360 products.
Dashboard
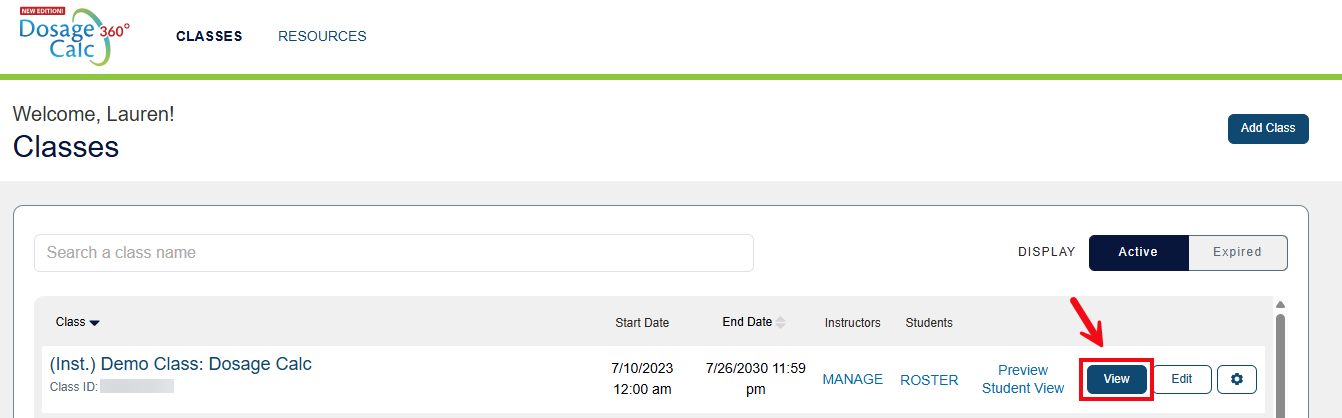
To access its Dashboard, select the View button next to a class.
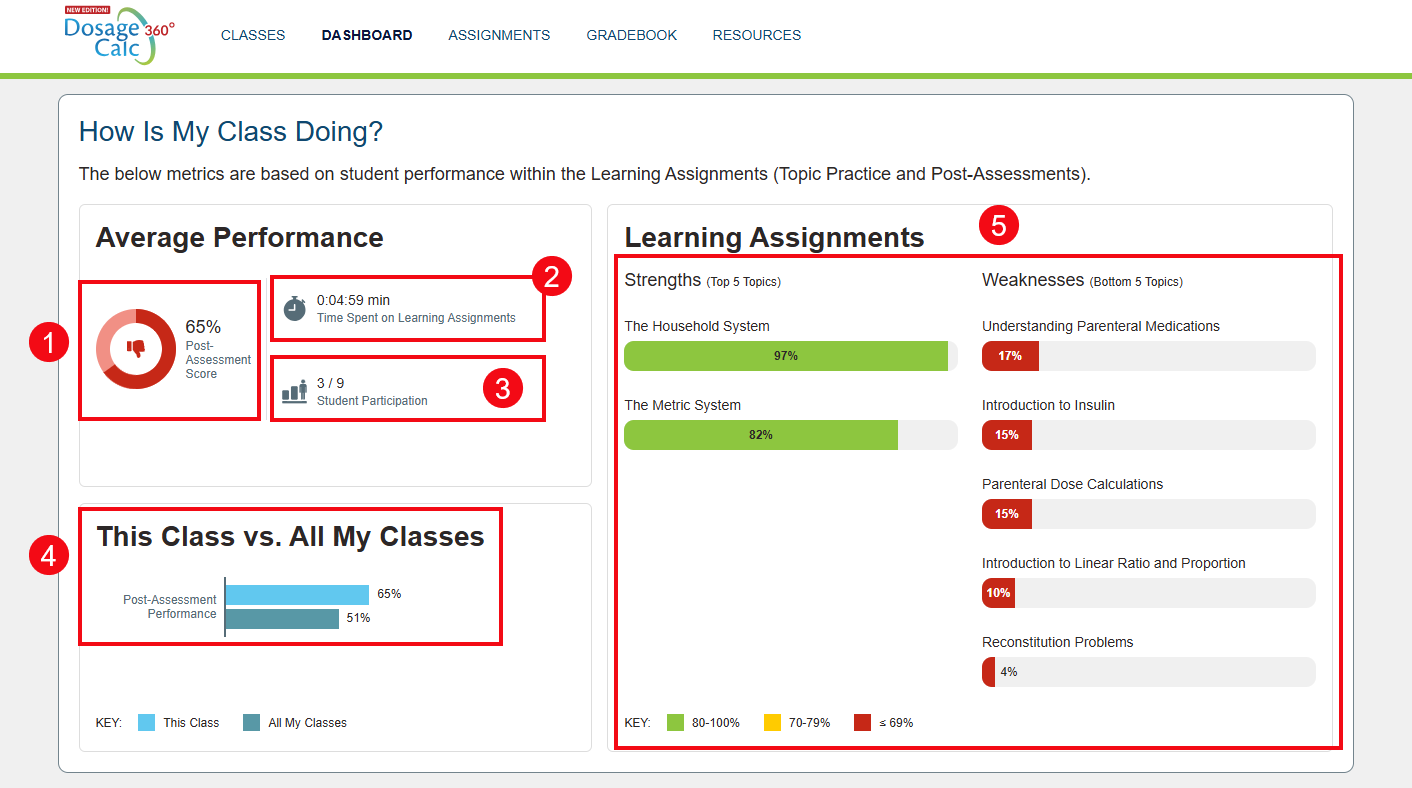
On the main Dashboard page, the How is My Class Doing? panel provides class-wide metrics on average performance (1), time spent on assignments (2), and participation rates (3). This panel also allows you to compare your current class's average performance against the combined average of all of your class sections to date (4). As your students complete more work in the platform, the Dashboard will also populate strengths and weaknesses (5) to show you your students' strongest and weakest topic areas.
View Assignments
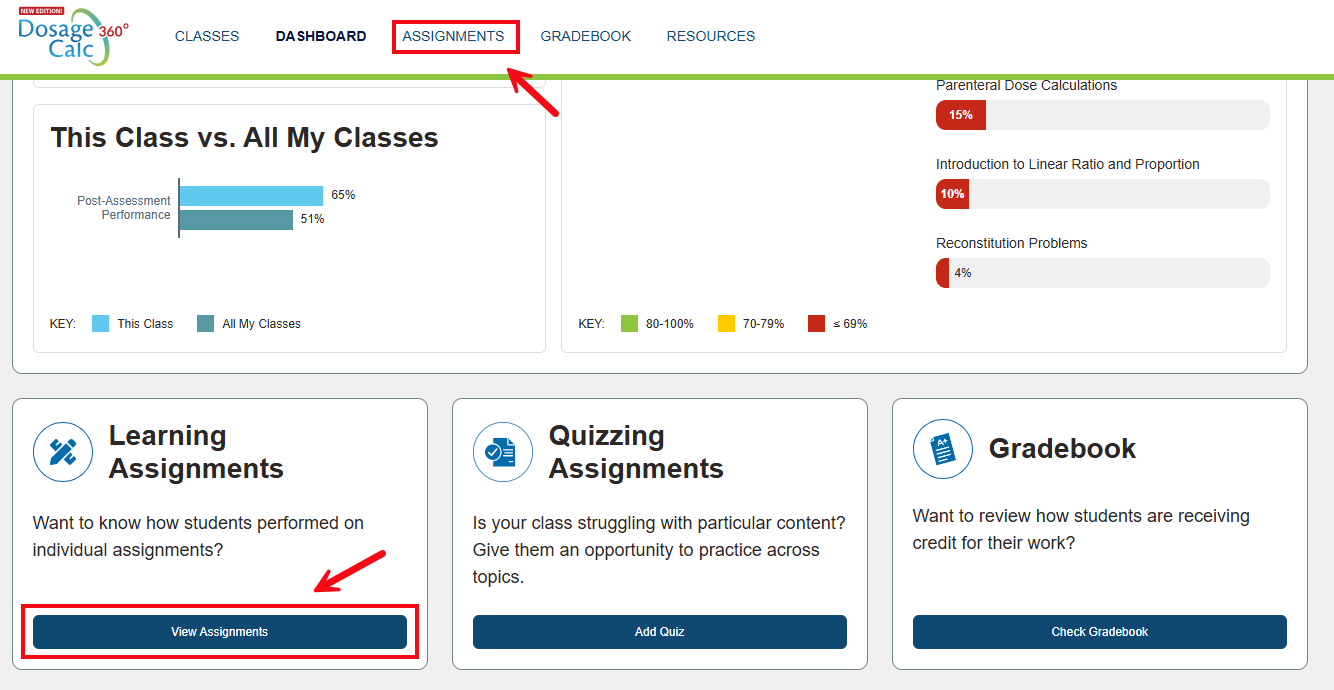
To view your students’ performance on each assigned topic, click the Assignments tab at the top of the page, or the View Assignments button located in the Learning Assignments panel at the bottom of the Dashboard.
In the Assignments view, you can review due dates, student participation/completion rates, and average time spent on specific Learning and/or Quizzing Assignments.
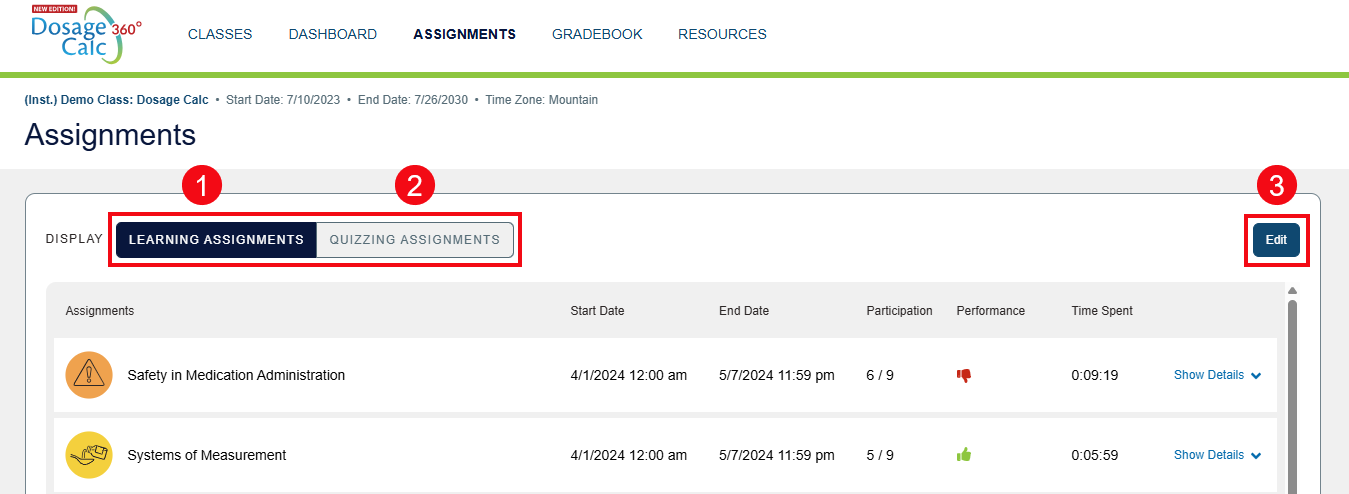
On the Assignments page, you can review due dates, student participation/completion rates, and average time spent on specific Davis 360 assignments. There are two display options, Learning Assignments (1) and Quizzing Assignments (2). You can also quickly access your Class Setup from this page to Edit Assignments (3).
The assignments page will open by default to the full list of Learning Assignments for your course. For overall assessment performance, you will see the following…
Red thumbs-down: The average score for the class on the assessment is less than or equal to 69%.
Yellow thumbs-up: The average score for the class on the assessment is between 70–79%.
Green thumbs-up: The average score for the class on the assessment is 80% or above.
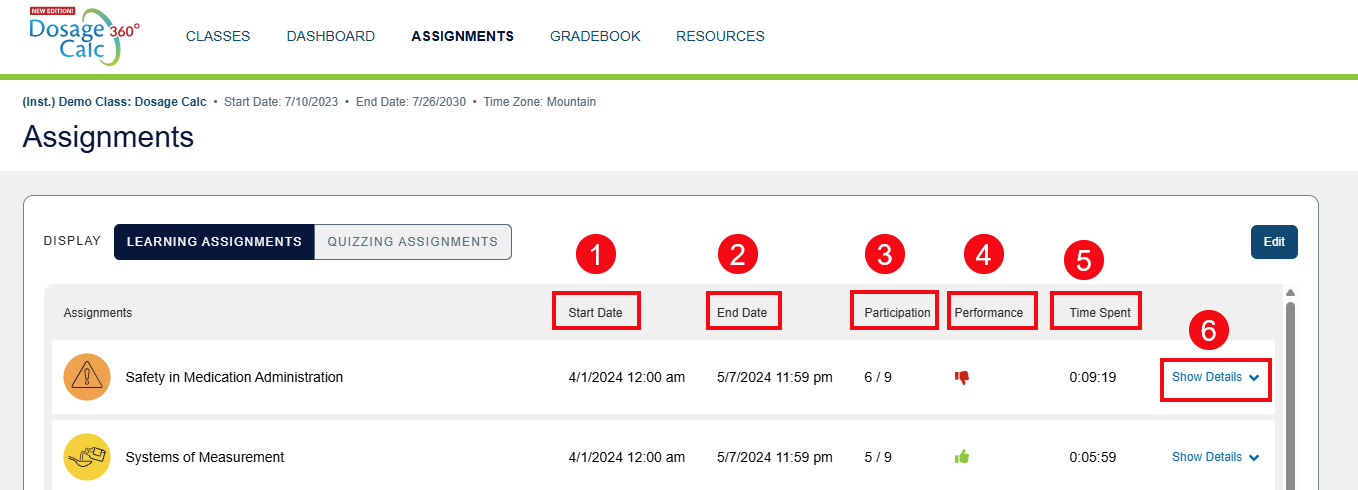
For each topic listed, you will also see the assignment Start Date (1), End Date (2), the participation (3), the average performance (4), the average time spent on the assignment (5), and the show details option (6).
View Student Details
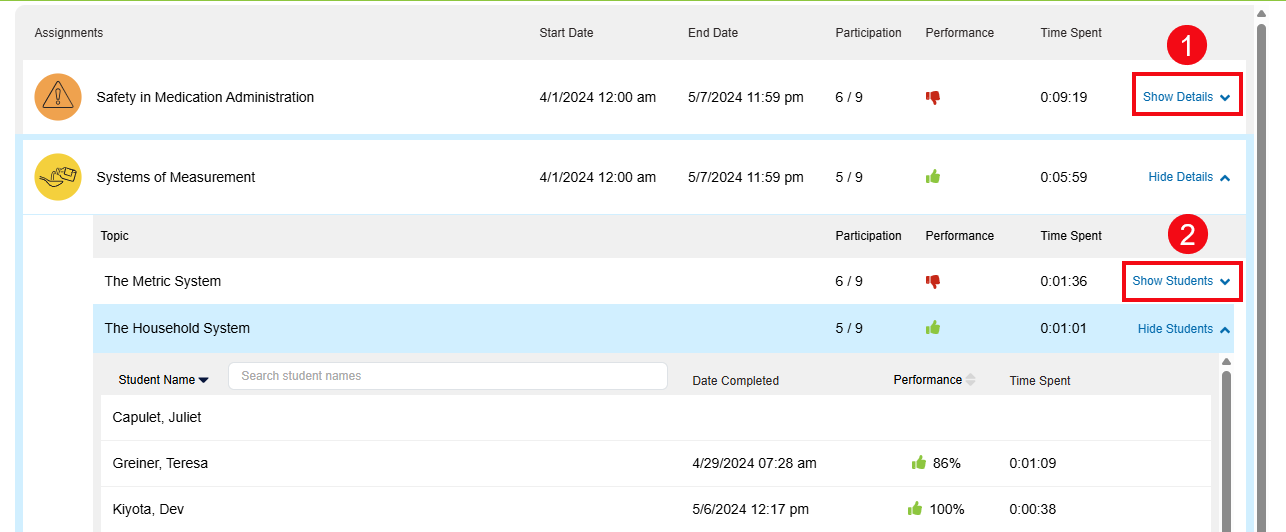
Clicking Show Details (1) allows you to view more top-down metrics for the subtopics within a module. The Details view shows the participation rate, average performance and time spent for each topic within the learning assignment, as well as the Post Assessment. To see how individual students performed on a specific topic, select Show Students (2).
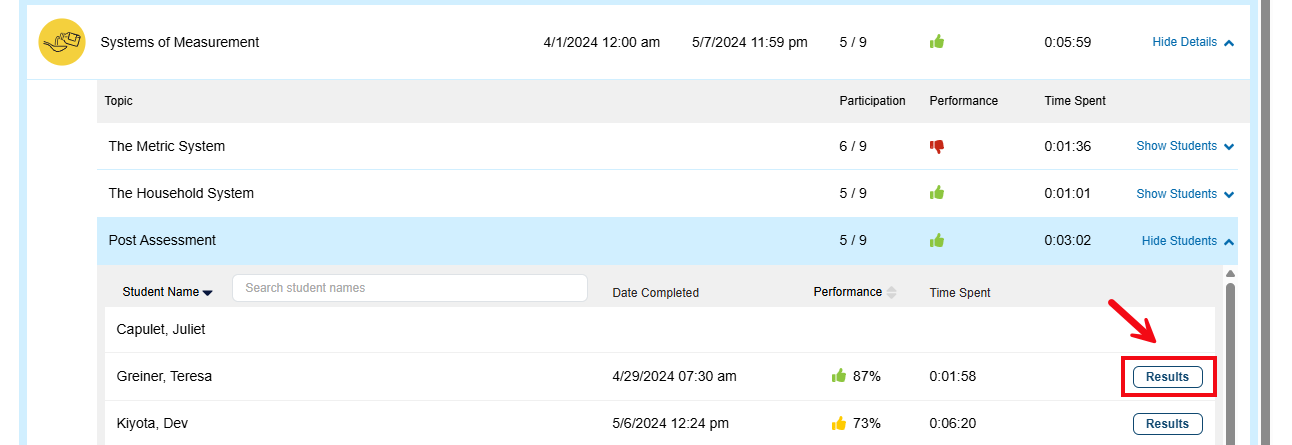
The Show Students view allows you to see each student's performance-based score on the activity you've selected, as well as date completed and time spent. For Post Assessment assignments, you can also view each student's answers by clicking the Results button.
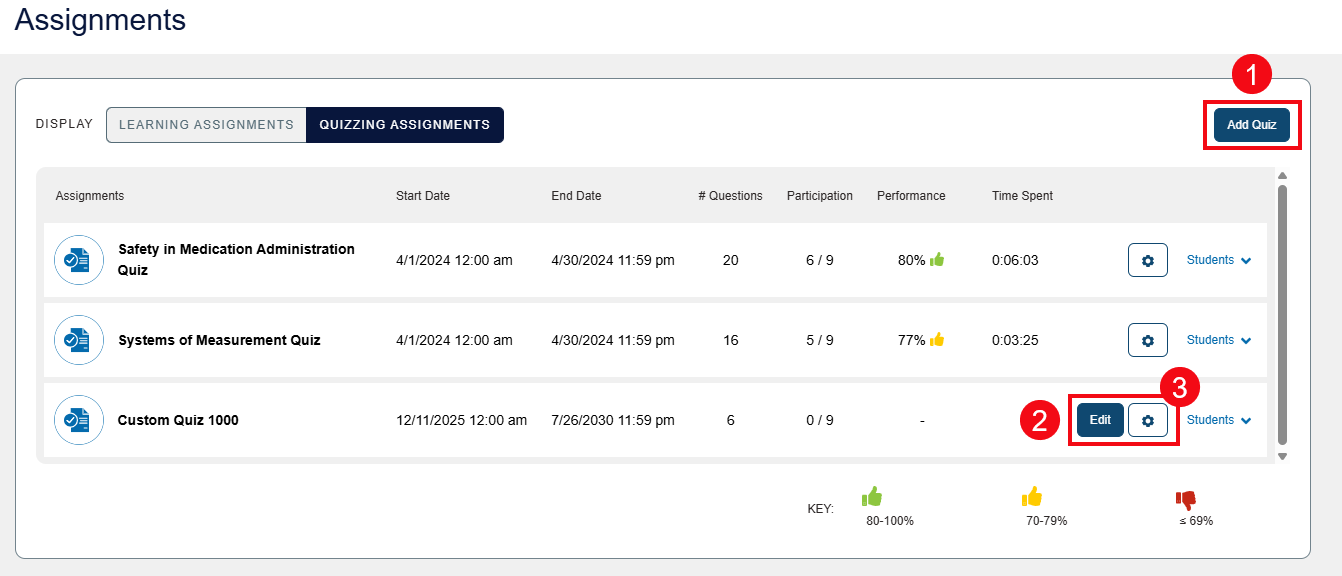
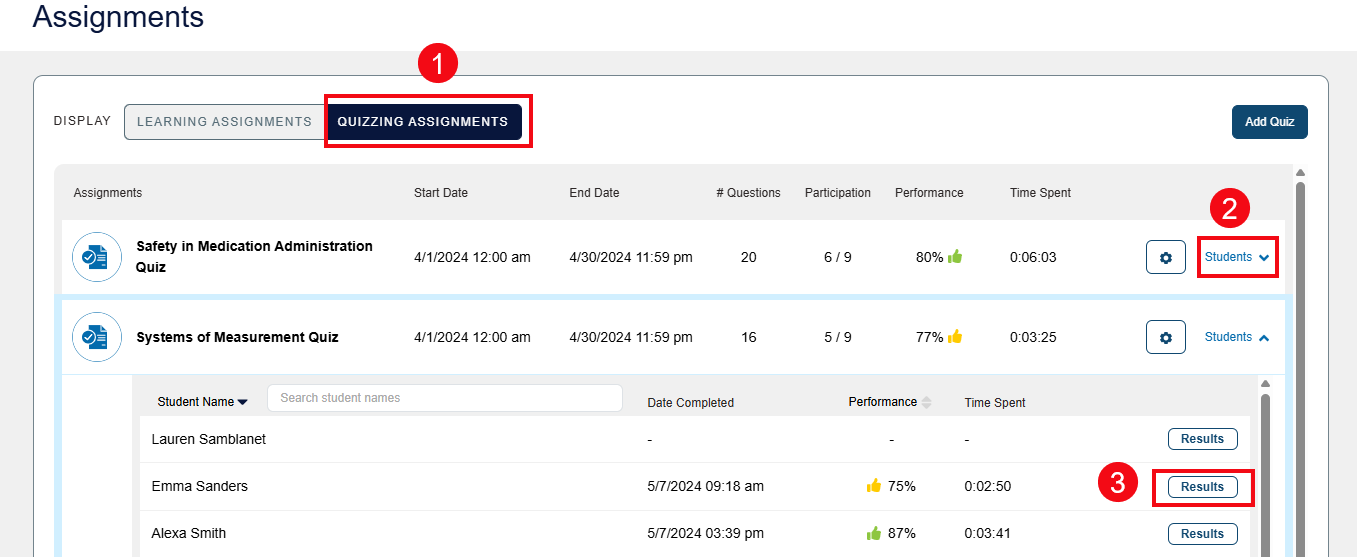
By changing the display to Quizzing Assignments (1), you can view metrics for quizzes. The Quizzing Assignments display allows you to review the start date, end date and number of questions for each quizzing assignment you've created. To see individual student metrics like the date the quiz was completed, scores, and the time spent on the assignment, click the Students option (2). Select the Show Students tab to view individual student results. Click the Results button (3) to see an individual student's responses to the questions.
You can add new quizzing assignments to your course using the Add Quiz button (1) in the upper right corner. If students have not begun working on a quiz, you can select the Edit button (2) to update the parameters and questions in that quiz. The settings icon (3) can be used to Preview a finished quiz as it will appear to your students, or to Delete a quiz you no longer want to assign.